Meteora’s Dynamic Terminal features a fully integrated chart by TradingView — the same charting platform trusted by millions of professional traders worldwide to track Bitcoin price and broader crypto trends. No need to switch tabs or use a separate tool. Everything you need to analyze price and manage your liquidity position is in one place.Documentation Index
Fetch the complete documentation index at: https://docs.meteora.ag/llms.txt
Use this file to discover all available pages before exploring further.
Why TradingView for Liquidity Providers?
Concentrated liquidity is inherently a range game. The quality of your price range decision determines:- How much trading volume passes through your position
- How often you earn fees vs. sitting out of range
- Your exposure to impermanent loss
What’s Included
Advanced Charting
A full-featured price chart with access to the same tools professional traders use:- 100+ technical indicators — moving averages, RSI, MACD, Bollinger Bands, volume profiles, and more
- Multiple chart types — candlestick, bar, line, area, Heikin Ashi, and more
- Multiple timeframes — analyze from 1-minute candles all the way to weekly charts
- Zoom controls — focus in on a specific breakout or zoom out for the full macro picture
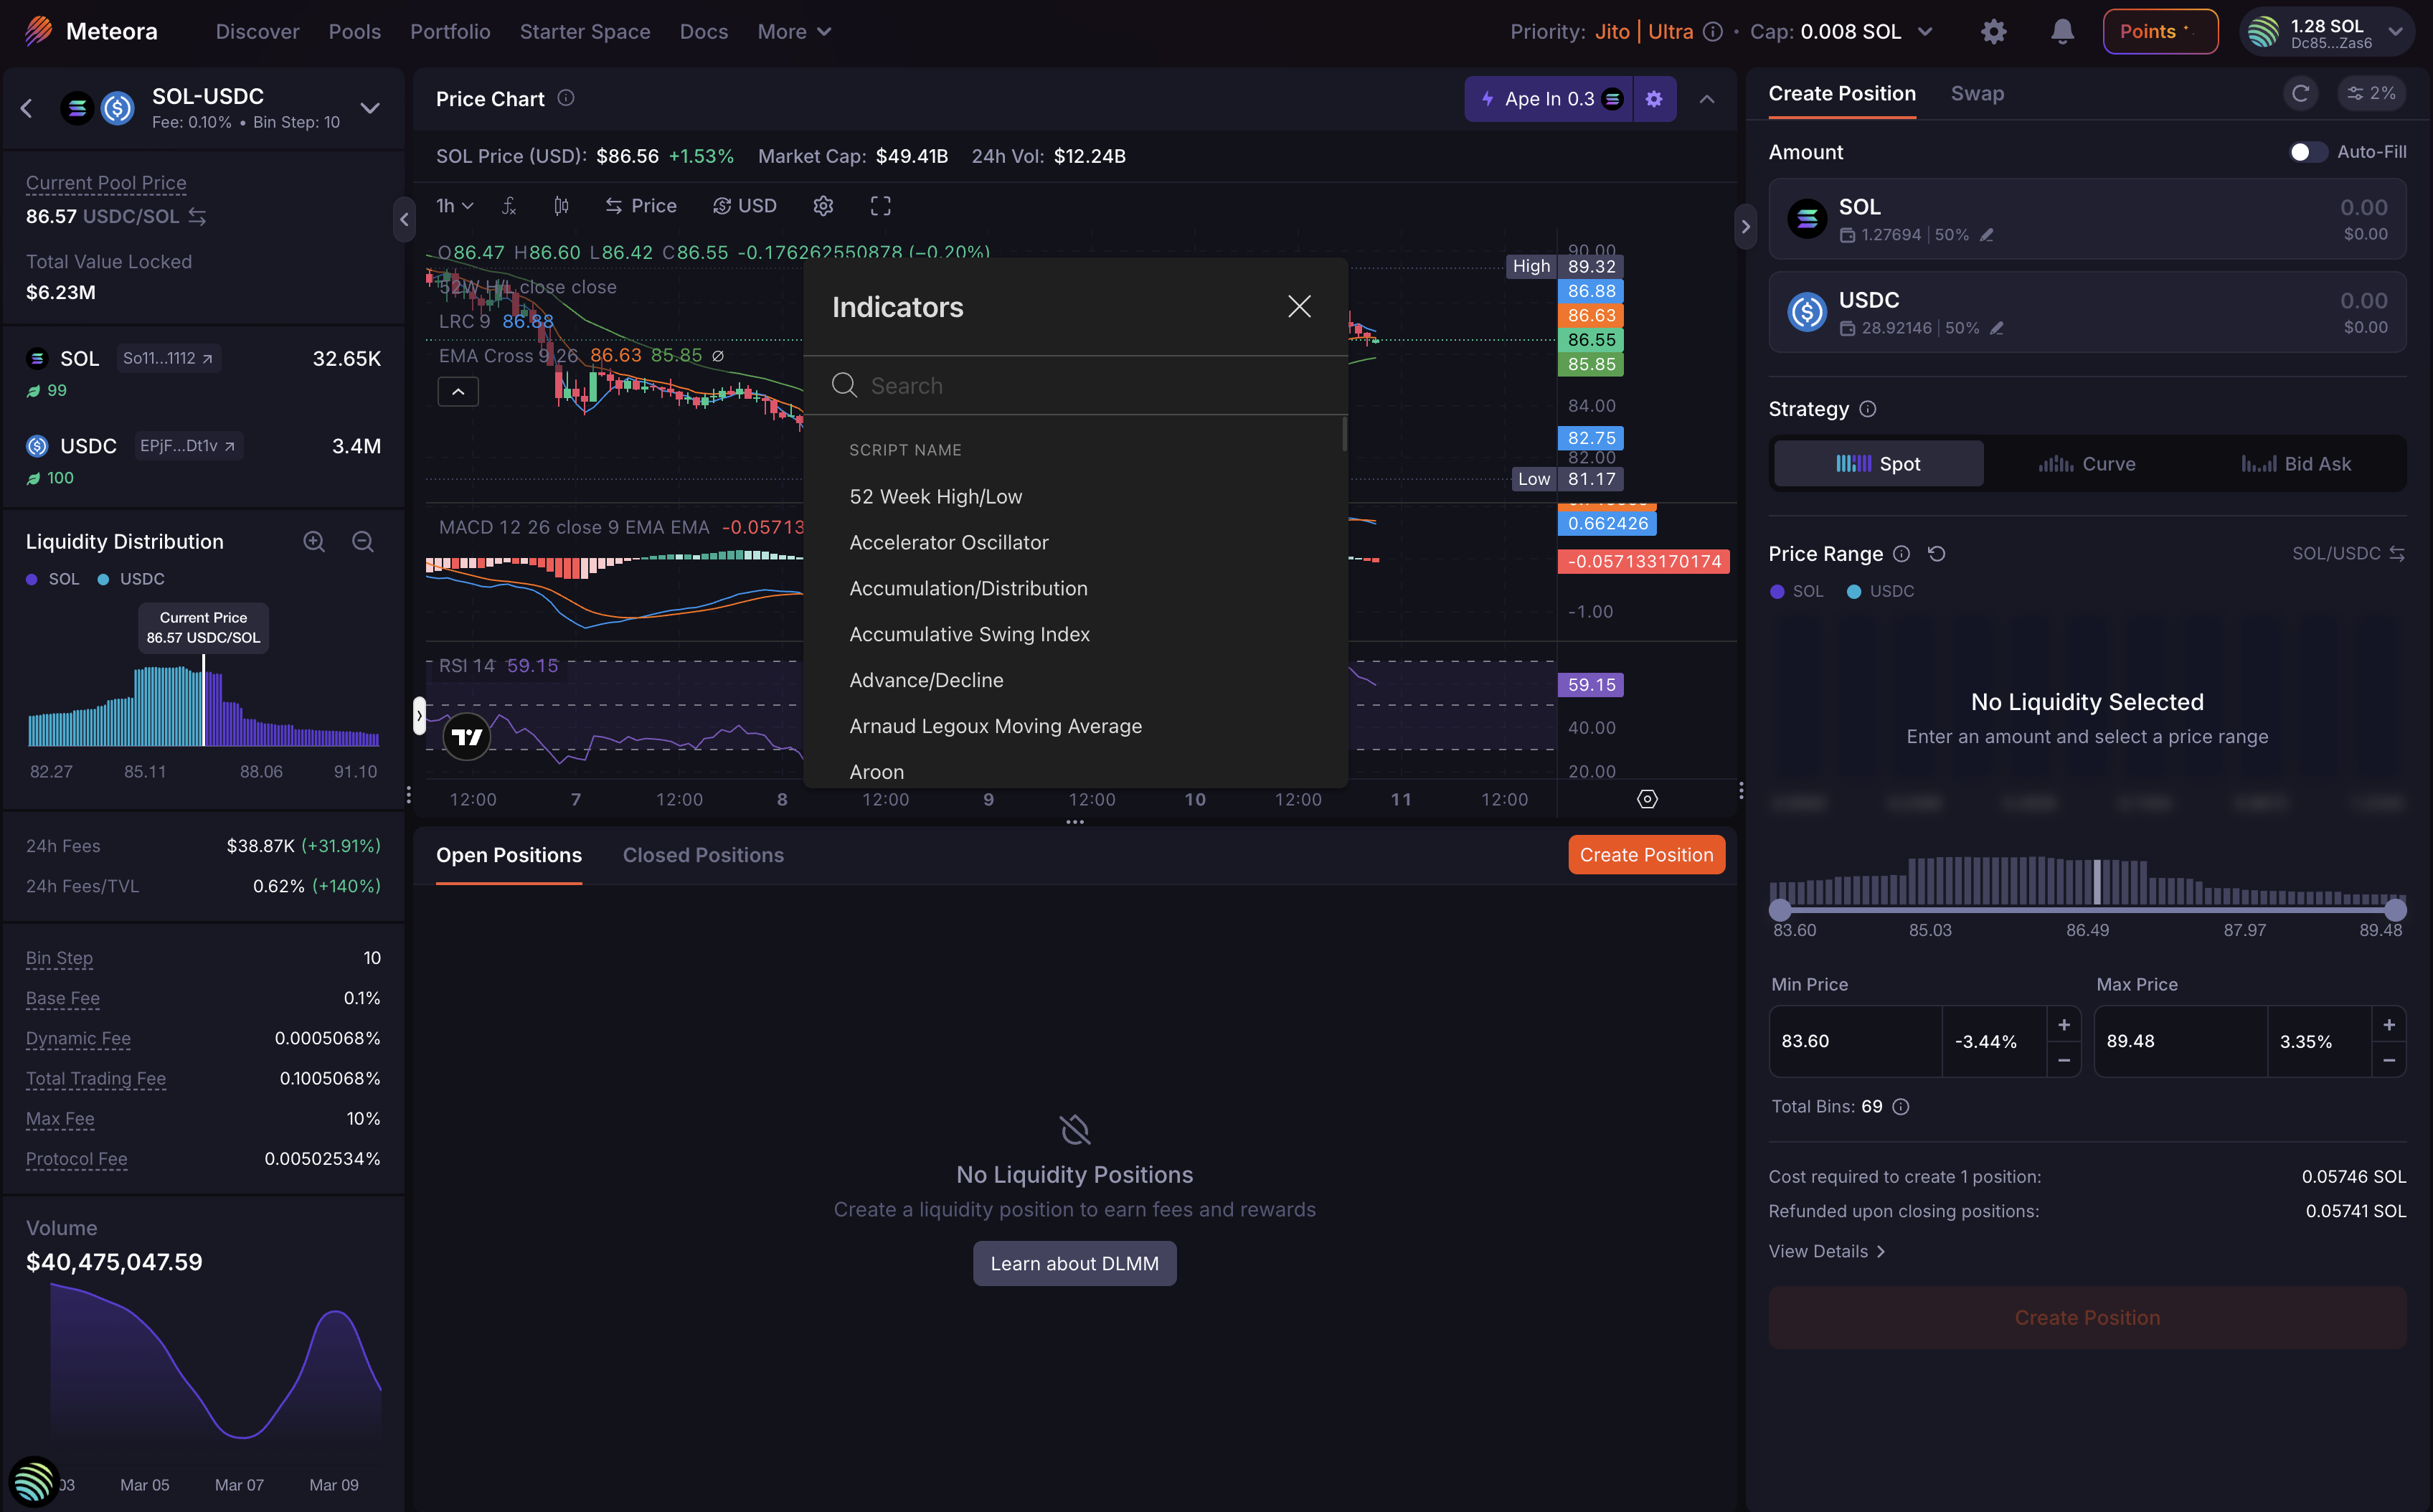
Smart Drawing Tools
Annotate your chart with precision:- Trend lines and channels — identify directional momentum
- Support and resistance levels — mark the key price zones that inform your min and max range
- Fibonacci retracements — spot potential reversion levels for range placement
- Text notes and labels — annotate directly on the chart for context
Persistent Layout
Your chart setup is automatically saved. Indicators, drawn levels, and timeframe preferences persist across sessions — so your analysis is always there when you come back.Collapsible Panel
Hide the chart entirely with a single click when you don’t need it, and bring it back instantly. The Dynamic Terminal adapts to your workflow.How to Access TradingView Charts
The TradingView chart is built directly into the Dynamic Terminal — no setup required.- Go to meteora.ag
- Select a DLMM pool from the pool list
- The Dynamic Terminal opens with the TradingView chart in the center panel
- Use the toolbar at the top of the chart to switch timeframes, add indicators, or use drawing tools
How LPs Use TradingView to LP Better
Setting Tighter, More Strategic Ranges
Instead of guessing your min and max price, anchor them to levels that matter on the chart:- Use support levels as your min price — price is likely to find buyers here
- Use resistance levels as your max price — price may struggle to push past here
- Use Fibonacci retracements to identify likely reversion zones for range-bound strategies
Timing Your Entries
Entering a position when price is trending strongly against your range means going out of range immediately. Use the chart to:- Look for consolidation zones near your target range — tighter price action = more time in range
- Check momentum indicators before committing capital to a concentrated range
- Wait for volatility to settle before opening positions in high-activity periods
Monitoring While Active
While your position is open, use the chart to stay aware of market conditions:- Watch for breakouts that may push price out of your range
- Use the chart to decide whether to rebalance, hold, or exit
- Apply volume analysis to gauge whether trading activity through your range is likely to continue
Reducing Impermanent Loss
Impermanent loss increases when price moves significantly outside your range. Better chart analysis helps:- Avoid entering ranges that are already extended and likely to revert
- Set wider ranges in high-volatility conditions to stay in range longer
- Exit before a clear trend pushes price far outside your position
Available on All Devices
The TradingView chart in the Dynamic Terminal is accessible on desktop and tablet. Whether you’re actively managing positions or doing pre-entry analysis, the charting tools are always within reach.Get Started
The Dynamic Terminal with TradingView charts is live now at meteora.ag.- How to use DLMM Dynamic Terminal — full guide to the Dynamic Terminal interface
- LP Army Bootcamp — strategies for using chart analysis in your LP workflow
- Join the LP Army — connect with the community
Charts powered by TradingView — the world’s leading financial charting platform.